 Cost Of Quality History & Introduction
Philip Crosby once said “Money is the language of management; you need to show them the numbers.”
This was true when he first said it many years ago & it’s even more true today as industries have become more competitive & complex.
Joseph Juran also understood the important link between Money & Quality when he introduced the concept of Quality Cost in his first edition of the Quality Control Handbook published in 1951.
The concept was further expanded on by Armand Feigenbaum in his 1956 Harvard Business Review essay Total Quality Control when he introduced the 4 Quality Cost Categories that are commonly referred to today.
Since then, the Cost of Quality concept has been continuously improved into a fully developed financial model that has many strategic benefits.
This Chapter will break down The Cost of Quality into its key concepts, which include:
- The Total Cost of Quality & the 4 Quality Cost Categories
- The Quality Cost data collection methods for each category
- The reporting and interpreting of Quality Cost results
- The COQ Benefits & Limitations
4 Quality Cost Categories – Total Quality Cost
When it comes to Quality & Cost, there are 4 different Categories that can be utilized to capture your quality related costs, these are:
- Prevention Cost – costs associated with activities specifically designed to prevent poor quality in products.
- Appraisal Cost – costs associated with activities specifically designed to measure, inspect, evaluate or audit products to assure conformance to quality requirements.
- Internal Failure Cost – costs incurred when a product fails to conform to a quality specification before shipment to a customer.
- External Failure Cost – costs incurred when a product fails to conform to a quality specification after shipment to a customer.
The Total Quality Cost then is simply the sum of all these cost categories; Prevention, Appraisal, & Failure Costs (Internal & External).
The Total Quality Cost can be summarized as all investments in the prevention of defects, the testing of product to assure Quality, or the failure of a product to meet a customer requirement.
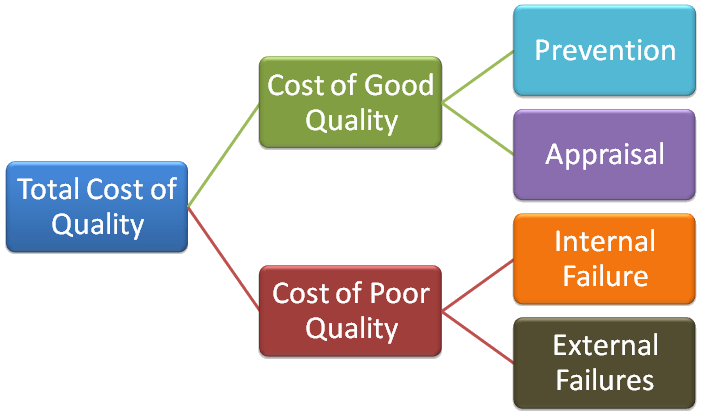
As you can see, there are really two “good” quality cost categories (Prevention & Appraisal) and two “bad” categories (Internal Failures & External Failures). These are known as the Cost of Good Quality & the Cost of Poor Quality.
This is where the Cost of Quality perspective can be very powerful in that it helps you understand where you’re investing (or wasting) your money.
Are you spending your money preventing defects and assuring quality, or are you spending your money performing rework and handling customer complaints?
This perspective can also help you understand the difference between the actual cost of the product your producing & what the cost could be if Quality was perfect.
These cost categories can also be re-stated from the “Right The First Time” perspective.
All you need to do is to ask yourself is “If all our processes produced the correct result the 1st time, would this cost still be here?”
For example, Prevention & Appraisal costs ensure that a task was conducted right the first time, and Failure Costs, both internal & external, occur when a task is not performed right the first time.
In 1999, Juran published the 5th addition of Juran’s Quality Handbook where he included the following depiction of the Quality Cost Curve.
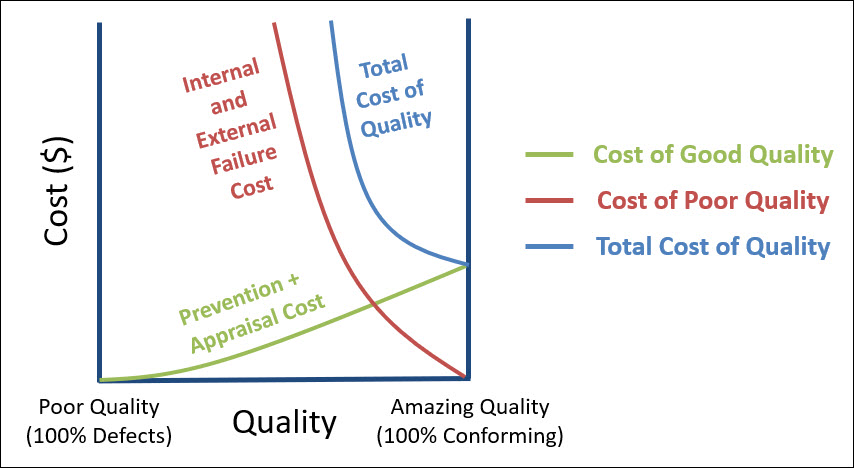
This is super important – so the X-Axis is the Quality Level which moves from 0% conformance on the left to 100% conformance on the right.
As you move from 0% conformance to 100% conformance the Prevention & Appraisal Costs increase linearly. Similarly, the Failure Costs (Internal + External) begin decreasing sharply.
Then, the Total CoQ (Cost of Quality), which is a sum of these two other curves also decreases sharply.
One key conclusion that Juran is communicating with this graph is that the Total CoQ is the lowest, when conformance is 100%. At this point, the Total CoQ simply equals the Cost of Prevention & Appraisal.
Prevention Cost
As we said above, Prevention Costs are those costs or activities that are specifically designed to prevent poor quality in products.
These costs ensure that product is built right the first time by preventing or reducing errors from occurring.
As we say above, investments in this category result in a lower total COQ over time always have the best Return On Investment (ROI).
Prevention costs should be viewed as an investment in cost-avoidance.
By avoiding a non-conformance you’ll eliminate all the waste associated with that non-conformance.
These include the wasted material (scrap/rework/etc), the man-power required to investigate and disposition the non-conforming material, and the lost opportunity cost/equipment capacity associated with your time & equipment and many more hidden costs.
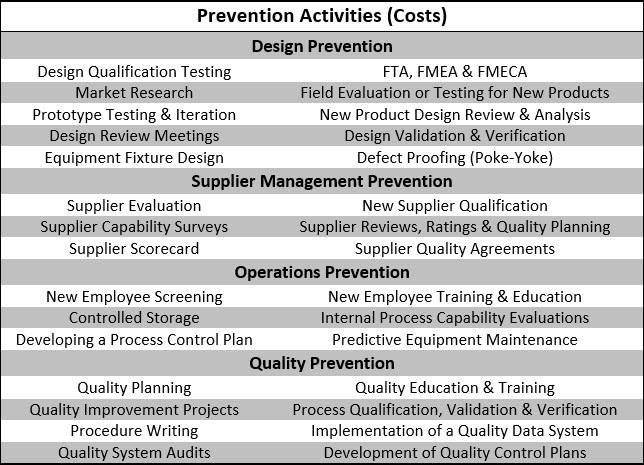
Also if your prevention activities are powerful enough, you can also eliminate any need to appraise a product for conformance. In essence, you are ensuring that the product or service is always made right the first time; examples include:
Edwards Deming once said “Quality comes not from inspection but from improvement of the process.”
What he’s saying here is that we should shift our focus from failures & appraisal, to prevention through improvement.
Appraisal Cost
Appraisal costs are associated with any activity specifically designed to measure, inspect, evaluate or audit products to assure conformance to quality requirements.
These are costs incurred to check & verify that product was built right the first time.
Appraisal costs are also considered an investment, not a loss, because you’re assuring that quality specifications have been met, and you’re preventing unnecessary failure costs, etc.
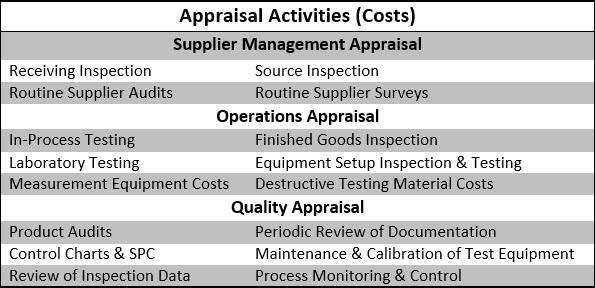
Below is a list of examples of activities that are generally classified as Appraisal activities:
Internal Failure Cost
Internal Failure Costs are any cost incurred due to the failure of a product to meet a customer requirement where the non-conformance was detected prior to shipment to the customer.
These costs are incurred when product is not built right the first time, prior to delivery to the customer. These costs are a financial loss.
It’s important to remember that the further along in the operating process that a failure is discovered the more expensive it is to correct.
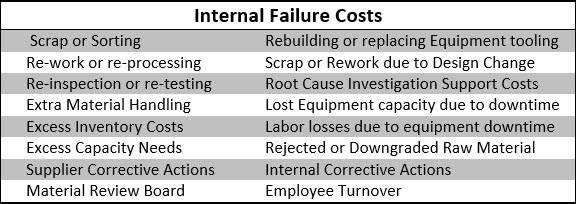
As these types of failures are identified, either internally through Appraisal or externally by the customer, corrective action should be taken to eliminate the causes of these failures, see below for a list of Failure Costs:
External Failure Cost
External Failure Costs are any cost incurred due to the failure of a product to meet a customer requirement where the non-conformance was detected after shipment to the customer.
External Failure Costs are, by far, the most expensive category of Quality Cost.
Because the non-conformance went undetected, your company now has paid to package and ship this defect to a customer, which will only result in dissatisfaction and return.
If the non-conformance had been detected in the process, it could have been sorted, scrapped or re-worked prior to shipment.
These failures occur because the Prevention activities & Appraisal process (Inspection & Testing) did not detect the error before shipment which now has resulted in customer dissatisfaction & additional costs.
Failure Costs can also be viewed as a penalty for poor quality.
This penalty can be avoided through prevention & appraisal.
High risk or frequently occurring External Failures can also result in very costly actions like Recalls & Legal situations, see below for a list of external failure costs:

Taguchi’s Loss Function & Cost
Genichi Taguchi was a Japanese Engineer & Statistician who developed a Quality Loss Function (QLF) to depict what happens to cost as a part or component deviates from the nominal value.
This loss function is based on the premise that Quality Cost does not suddenly plummet the moment a component moves outside the specified range. The loss begins whenever the product varies from the nominal target, even within the allowable range.

By understanding Taguchi’s Quality Loss Function, you can recognize that the total cost of quality is reduced through the reduction of variation, even if that variation is within the specification.
This is aligned with the concept of Six Sigma, which is based on the idea that less variation reduces the total cost of quality. The same logic applies to the “Zero Defects” school of thought.
Taguchi’s also went on the expand on his Quality Loss Function principle to include these primary ideas:
- Cost can be reduced by improving Quality
- Cost can be reduced by decreasing Variation
- Quality can be improved without affecting Cost
- Cost cannot be reduced without affecting Quality
Implementation of a COQ Financial System
Many organizations have benefited from the implementation of a Cost of Quality Financial System – however the implementation of this type of system can be difficult.
First off, it’s an understatement to say that Management support is Vital. So if you’re interested in implementing a COQ Financial System, you either need to be Upper Management, or you need to influence them!
If you’re not upper management, you’re going to have to gain their support by showing the benefits & results associated with a COQ financial approach.
The best way to show the benefits & value of this approach is to start with a Pilot program. This Pilot Program can verify, with actual data, that a quality cost system would be beneficial to the organization.
To launch a pilot program you have to go through 3 simple steps below.
Step 1 – Define your COQ Categories & Data Collection Method
To setup a COQ program that is consistent and accurate, you first must ensure that your Quality Cost Categories are defined, similar to the table above. This will ensure that costs are accurately and consistently categories correctly.
You would hate for the same cost (scrap) to bounce around from one category to another over time, causing fluctuations in your data.
Step 2 – Define your Data Collection Method & Responsible Person
Once you’ve standardized the categories associated with your data – it’s time to standardize the data collection method for each category. This includes defining the different sources of the data for each category.
Then find the individuals or departments within the organization who are impacted by these categories & data sources and assign them with the responsibility to collect this data. Strong collaboration here with your financial controller should bring credibility to the data sources & data collection method.
Step 3 – Collect, analyze & report Quality Cost data and drive improvements.
The next and final step in the process is the routine collection, analysis and reporting of COQ data.
Data should be reported as the actual costs or as reflection of your measurement base, which might include the percentage of sales, percentage of quality costs, percentage of cost of goods manufactured or relative to the number of units produced.
The key here, to this whole exercise, is the very end of step 3 – drive improvements – the Pilot means nothing unless you can deliver results.
Below are a handful of benefits to a COQ program that can steer you toward those opportunities for improvement that exist in your business.
The Goal & Benefits of a COQ Program
The ultimate goal of a COQ System is to reduce the total cost of quality – which will result in increased profitability & quality for the organization. This end goal is the foundation for all things Continuous Improvement.
A COQ Program can contribute to the overall increased profitability in the following ways:
- A COQ Program provide cost-benefit justification for needed Corrective Actions & Improvement projects.
- A COQ Program assists you in quantifying the costs associated with inefficient or incapable processes that result in unwanted variation & waste.
- A COQ Program highlights the importance of Prevention activities as an investment in cost avoidance, and as a method to reducing quality costs.
- A COQ Program Prioritizes & aligns your quality efforts & activities with your company’s financial goal of profitability.
- A COQ Program highlights strengths & weaknesses of the Quality & Manufacturing System.
- A COQ Program reframes improvement opportunities into financial benefits for ROI analysis.
- A COQ Program exposes waste & other opportunities for improvement.
- A COQ Program reminds all employees that their actions are always contributing to the organizations Bottom Line, either positively or negatively.
- A COQ Program drives a holistic perspective to Continuous Improvement by ensuring that the overall benefits of an improvement project do not result in unintended consequences somewhere else in the business.
COQ Limitations
There are a few limitations associated with a COQ Program.
The big one being that COQ Data by itself does not lead to improvement. Your COQ program it is merely a scoreboard for your current performance. You will still need to analyze your problems to determine what the root cause is and then take action to fix those problem.
Another limitation of the Quality Cost system is its inability to quantify the Hidden Quality Costs that every company experiences.
For example, let’s say you have a engineering department, where those folks are involved in new product development (prevention costs), CAPA’s (internal failure costs), and are associated with the internal auditing program (appraisal cost).
How do you accurately account for the time and effort spent in these different categories that all add up to what has become known as the Hidden Factory.
The Hidden Factory
The Hidden Factory is an expressions that has developed in parallel to the cost of Quality and it represents the percentage of an organizations total capacity or effort that is being used to overcome the cost of poor quality.
This can include the manufacturing operations labor, time & resources dedicated to re-work, re-processing, re-inspection, etc. It can also include the space in your warehouse dedicated to storing non-conforming product, etc.
It can also represent the hidden labor costs, similar to the example above, for all sorts of engineers who must dedicate their time to correcting problems or dealing with poor quality.
Effectively, the hidden factory represents any cost expended to do things right the second time.
It can be difficult to properly uncover and account for all the activities or costs associated with the hidden factory. It is not uncommon for significant chunks of quality costs to be overlooked or unrecognized simply because most accounting systems are not designed to identify them.
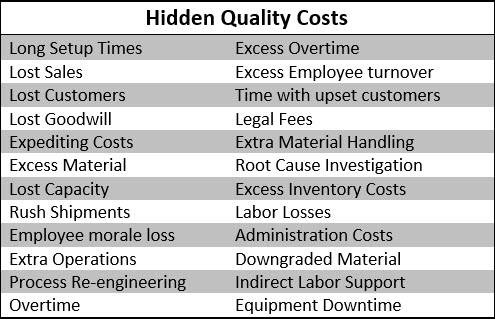
Below is a list of activities that represent a portion of the Hidden Factory:
Summary
Benjamin Franklin once said – “An ounce of prevention is worth a pound of cure”
This Chapter has covered the following key topics of The Cost of Quality:
- The Total Cost of Quality & the 4 Quality Cost Categories
- The Quality Cost data collection methods for each category
- The reporting and interpreting of Quality Cost results
- The COQ Benefits & Limitations
We learned that the total cost of quality can be categorized in one of four Cost of Quality Categories.
Two of the four categories, Prevention & Appraisal Costs, are called the Cost of Good Quality because they are costs that ensure that the product is built right the first time.
The other two cost categories, Internal & External Failure Costs, are called the Cost of Poor Quality are a penalty companies pay when they don’t build product right the first time. These are called the Cost of Poor Quality. The optimum cost situation is when the Cost of Poor Quality is zero.
Adopting a Cost of Quality program is an excellent way to align your business results of profitability to your Quality efforts. This COQ Program is achieved through 3 general steps.
- Step 1 – Define your COQ Categories & Data Collection Method
- Step 2 – Define your Data Collection Method & Responsible Person
- Step 3 – Collect, analyze & report Quality Cost data and drive improvements.
We also discussed the benefits of a COQ program, which include:
- providing cost-benefit justification for needed Corrective Actions & Improvement projects.
- quantifying the costs associated with inefficient or incapable processes that result in unwanted variation & waste.
- highlighting the importance of Prevention activities as an investment in cost avoidance, and as a method to reducing quality costs.
- driving a holistic perspective to Continuous Improvement by ensuring that the overall benefits of an improvement project do not result in unintended consequences somewhere else in the business.
Finally we discussed the limitations of a COQ program which include the fact that a COQ program by itself does not lead to improvement. You will still need to analyze your problems to determine what the root cause is and then take action to fix those problem.
Another limitation of the Quality Cost system is its inability to quantify the Hidden Quality Costs that every company experiences.
These Hidden Quality Costs are often referred to as the Hidden Factory and represent the percentage of an organizations total capacity or effort that is being used to overcome the cost of poor quality.