Overall Equipment Effectiveness
One of the most important metrics in Lean Manufacturing is Overall Equipment Effectiveness (OEE).
In this lecture, I want to explain the 3 elements of OEE, and how to calculate the Overall Effectiveness of your Equipment.
Availability
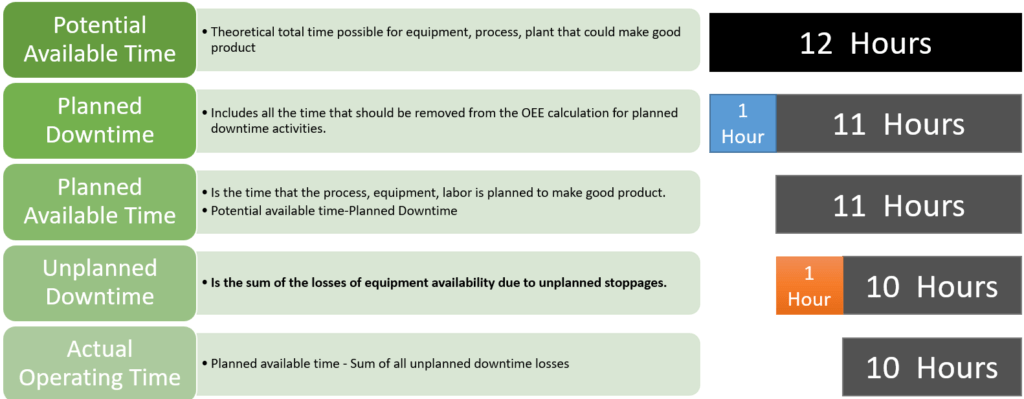
Availability Reflects capacity (and effectiveness) losses due to equipment failures, setup and adjustments. To calculate availability, you must be familiar with different time elements associated with your equipment.
Remember, the planned downtime is not included in the availability calculation.

Once we know these critical time values, we can complete the availability calculation.

The interpretation for this result is that, over the course of this shift, the equipment was available 91% of the time.
The other 9% of the time the equipment was down or unavailable.
In terms of continuous improvement, it’s important to collect data on why the equipment was not available, so that you can investigate the root cause and improve the process.
Performance
Performance reflects losses due to idling, stoppages and slower machine pace.
The two main components in Performance include your actual output, in comparison to your theoretical output.

Actual output is easy, the operations team simply reports the total quantity of units produced.
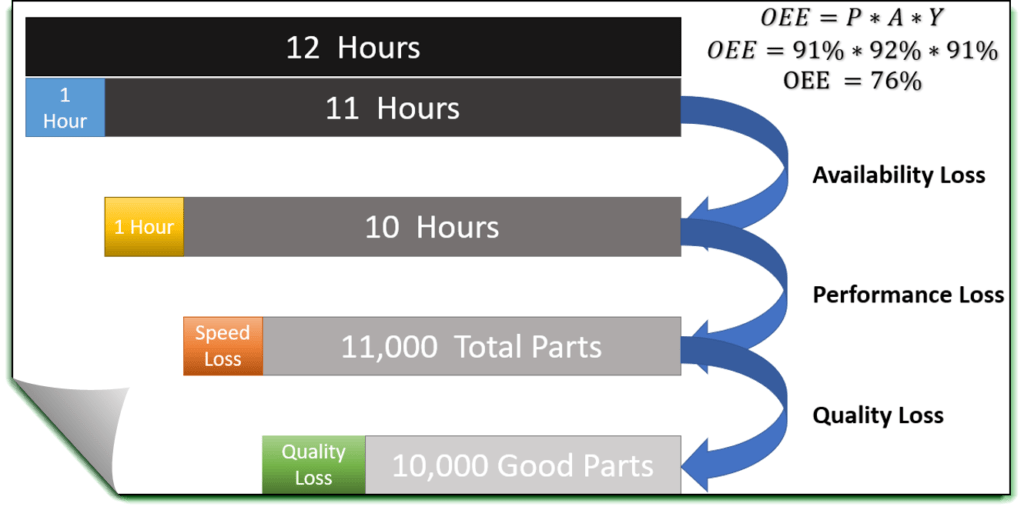
For example, let’s say operations reports 11,000 units produced.
The theoretical calculation requires some calculation.
This is a function of the cycle time associated with the equipment, and the planned run time.

To calculate the equipment hourly capacity, we must know the equipment’s cycle time. For example, if an equipment has a cycle time of 3 seconds per part, that means that the equipment should product 20 parts per minute.
3 seconds per part → 20 parts per minute → 1,200 parts per hour
Then, if the equipment runs for 10 hours, the theoretical output would be 12,000 parts.

Yield
Yield reflects losses due to process defects and reduced product yield.
Yield is calculated as the ratio of good parts/total parts built.

Let’s say that we produced a total of 11,000 parts, and only 10,000 of them are good parts.

Final OEE Calculations
All of these metrics (Yield, Performance and Availability) are calculated a decimal value or a percentage, and are combined to calculate the OEE of a piece of equipment.

Below you can visualize how each of the elements of loss (availability/performance and yield) contribute to the overall lost capacity of the equipment.

In terms of evaluating these results, world class OEE is generally considered to be 85%.
To improve your OEE, you should look at each component (Performance, Availability or Yield), to determine which element is contributing to the losses.
Then you can go through the DMAIC process to improve either the performance, availability or yield of the equipment.
Nowadays, several automated manufacturing pieces of equipment can be programmed to calculate OEE and track Performance, Availability and Yield.
This is data that sets the ground for a controllable environment such as Visual Factory.
Data Collection for OEE
A critical element of OEE is data collection. We must start with data to calculate availability, performance and yield.
This data collection should capture any downtime associated with breakdowns, change-overs, minor stoppages along with quality losses due to defects.

With this information, you can calculate the OEE for your equipment, which in turn should highlight opportunities for improvement.
By the way, you can get that FREE OEE Template below!!!!