
These tools can be used during the product & process design phase to improve Reliability/Quality & Safety of your product.
Get the Free Giveaway (Practice Exams, FMEA Template and the 10 Page Guide)
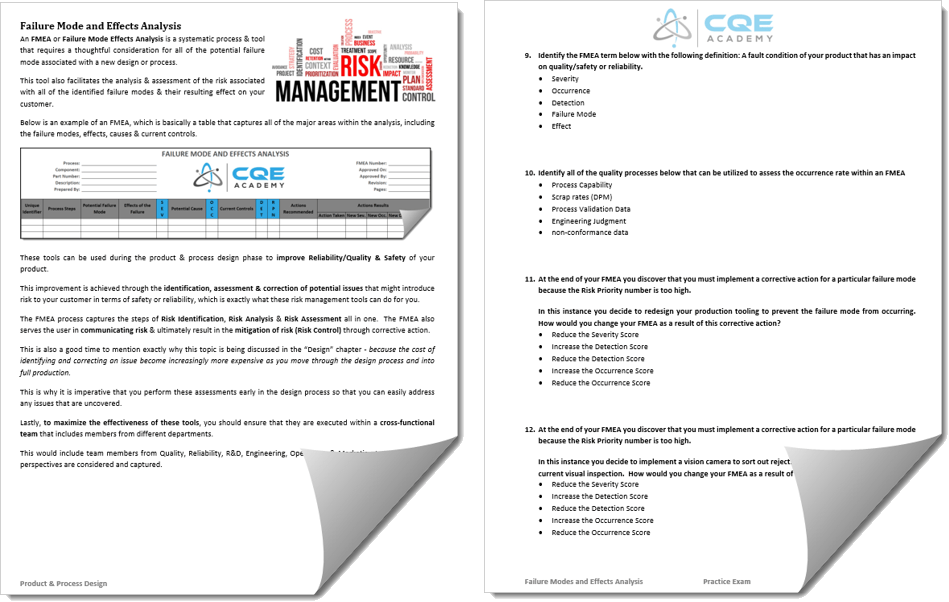
This improvement is achieved through the identification, assessment & correction of potential issues that might introduce risk to your customer in terms of safety or reliability, which is exactly what these risk management tools can do for you.
In this section we will define each of the 3 assessment tool below with a description of how each is constructed and a discussion of how to interpret each in order to improve your product/process:
- FMEA – Failure Modes and Effects Analysis
- FMECA – Failure Modes, Effects & Criticality Analysis
- FTA – Fault Tree Analysis
Each of these tools will be reviewed in depth, including a walk-through of each to show you how you to construct each, and then ultimately how to assess & interpret the results from a risk perspective.
We will also discuss how these Risk Management Tools fit within the entire Risk Management process.
For example, the FMEA process captures the steps of Risk Identification, Risk Analysis & Risk Assessment all in one.
The Criticality Analysis of an FMECA is another form of Risk Analysis that assists you in identifying high risk failure modes that require corrective action.
These tools also assist the user in communicating risk & ultimately result in the mitigation of risk (Risk Control) through corrective action.
This is also a good time to mention exactly why this topic is being discussed in the “Design” chapter – because the cost of identifying and correcting an issue become increasingly more expensive as you move through the design process and into full production.
This is why it is imperative that you perform these assessment early in the design process so that you can easily address any issues that are uncovered.
Lastly, to maximize the effectiveness of these tools, you should ensure that they are executed within a cross-functional team that includes members from different departments.
This would include team members from Quality, Reliability, R&D, Engineering, Operations & Marketing to ensure that all perspectives are considered and captured.
The Benefits of Risk Management
 By utilizing these tools (FMEA, FMECA, FTA) you’ll be working through the risk management process which has a ton of benefits for your organization and your customer.
From a design perspective, these tools provide a method for selecting the safest & most reliable design and or manufacturing process.
These tools can also be used to compare alternate designs against each other to determine which design has higher levels of reliability or safety.
These tools can also be useful in reducing the time required to design a product or process as it helps you to holistically understand the risks associated with your new product or process and avoid any design rework etc.
From a reliability/quality/safety perspective, these tools are very useful in identifying components that are critical to Safety/Quality/Reliability.
Identifying these critical features can allow you to take advantage of the pareto principle and focus your attention on the critical few during design, validation & eventually full scale production to deliver a product with quality/reliability & safety.
From a financial perspective (Cost of Quality), identifying and eliminating failure modes results in the reduction of internal & external failure costs (scrap, rework, complaints, etc) that drive down the Cost of Poor Quality & ultimately make your organization more cost effective.
Lastly, I think it’s important to note that these risk management tools can take a significant investment in time and resources, however if they are executed properly they will have a return on investment that will ultimately make it a cost effective decision.
The Relationship between Risk Management & Quality
It hasn’t been explicitly stated up until now, but one of the primary goals of having a product with high Quality or Reliability is the concept of Risk Management, and not the other way around.
That is to say, that we focus on Quality & Reliability to mitigate risk for our customers & risk for our business.
We mitigate risk that the product will fail and hurt someone, or risk that the product will fail and dissatisfy someone.
Subsequently, by improving Quality or Reliability, you’re inherently doing one of two things.
You’re either making your product safer by reducing the likelihood of occurrence of a hazardous situation for your customers. Or you’re ensuring that your product functions as intended and therefore drives customer satisfaction, etc.
So the concept of Quality & Risk Management are mutually inclusive – that is, you can’t have one without the other.
Risk Management Tools & other Quality Processes
Let’s also quickly discuss the relationship between these risk management tools and some of the other quality tools & processes out there.
First, these risk management tools are a key input to many different quality processes which include Design Inputs & Outputs, Design Validation & Validation, Process Design & Validation, Continuous Process Monitoring & your Quality Control Plan, your CAPA system, & your process for managing changes to your product & or process once your product is in production.
For example, during the Design Input & Design Output phase, the FMEA process can be used to identify CTQ’s (Critical to Quality) or CQA’s (Critical Quality Attributes), which are your products features or characteristics that ensure the performance & safety of your device.
Based on that definition, these CTQ’s or CQA’s naturally have an element of risk associated with them because, if they are not fully met by your product or process, they will introduce risk to your customer in the form of a hazardous situation, etc.
These CTQ’s from your FMEA should then be directly tied into your design validation & process validation activities; which ensure that your design meets your customers needs & intended use and that your process is capable of routinely producing product that meets specifications.
These CTQ’s essentially become the acceptance criteria of those validation activities. So you can see how the risk management process can have a huge impact on your ability to be successful in designing a new product or process.
Your FMEA, and it’s identified CTQ’s should then translate into your control plan during routine manufacturing.
This will ensure that your high risk product attributes or process steps are being appropriately controlled & monitored to mitigate the risk associated with a failure.
Lastly, your risk management tools should also be used to assist you in managing changes to your product or process.
If you’re making changes to a part of your process, you can go back to your PFMEA to understand exactly which quality attributes can be impacted by that process step. This can help you assess the level & type of testing required to support your proposed change.
The FMEA (Failure Mode Effects Analysis)
An FMEA or Failure Mode Effects Analysis is a systematic process & tool that requires a thoughtful consideration for all of the potential failure mode associated with a new design or process.
This tool also facilitates the analysis & assessment of the risk associated with all of the identified failure modes & their resulting effect on your customer.
Below is an example of an FMEA, which is basically a table that captures all of the major areas within the analysis, including the failure modes, effects, causes & current controls.

There are actually 2 different types of FMEA’s, the DFMEA (Design FMEA) & the PFMEA (Process FMEA). We will quickly discuss these below to review the differences, similarities & links between them that you must know as a Quality Engineer.
PFMEA & DFMEA (Differences, Similarities & Links)
The DFMEA or Design FMEA, is focused on analyzing and improving the reliability and safety of your new design, with a heavy focus on design deficiencies and an analysis of the different interactions, interfaces & product features associated with your new design.
One of the primary benefits from the DFMEA is that it helps to identify the product features, or product quality attributes, that have a relationship with your products functionality requirements or safety features, etc.
For example, the DFMEA should identify which product attributes or features can deviate in such a way that a harm can occur to the end user. These product attributes are commonly called CTQ’s (Critical to Quality) or CQA’s (Critical Quality Attributes).
These CTQ’s or CQA’s should naturally flow down in to your PFMEA for consideration as to how your process failures may result in the failure of one of those CQA’s.
As such, the severity for these CTQ’s or CQA’s can naturally flow down from your DFMEA to your PFMEA (assuming you’re using the same scale).
The PFMEA or Process FMEA, comes after the DFMEA and is focused on analyzing your manufacturing or assembly process to identify all potential failure modes and then subsequently assess the risk associated with those process deviations.
Both of these FMEA’s use inductive logic and are considered a “Bottoms Up” approach to risk management. Both FMEA types include single point failures only, and as such, neither type includes multi-failure analysis.
Also, they both generally operate on the same assumption that the inputs (raw material) to process & design are “nominal” and therefore don’t include those failure modes within either analysis.
While these FMEA’s have a different focus (design v. process) they both follow the same general process, which is outlined below.
The 10 Step FMEA Process
Below is a high level review of the 10 step FMEA process, where each step is discussed in more detail below.
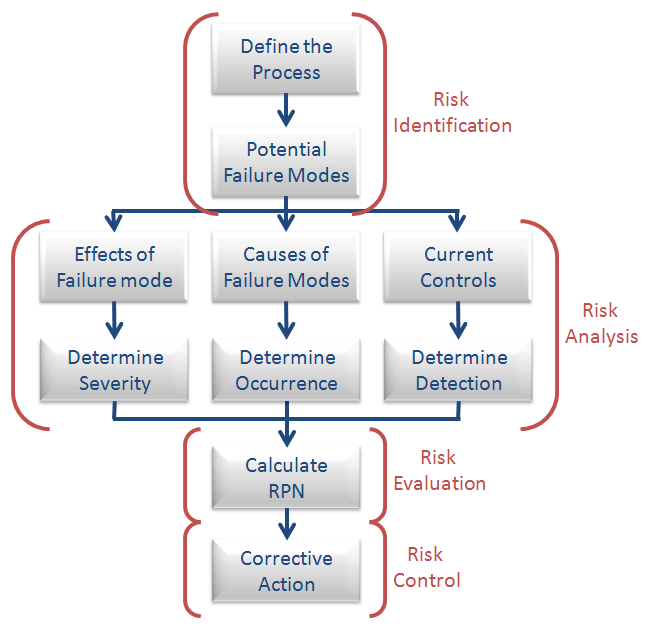
In terms of the overall risk management process, Steps 2 – 5 can be considered part of the Risk Identification process, while steps 5 – 8 can be considered part of the Risk Analysis & Risk Evaluation process.
Lastly, steps 9 & 10 are considered to be a big part of the Risk Control process and the entire document is meant as a Risk Communication & Risk Review tool.
- Establish the Ground Rules for your FMEA Process
- Define your System or Process to be Analyzed
- Identify the potential failure modes for each of your product attributes or process steps
- Determine the potential effect(s) of the failure mode on the system or customer
- Determine the potential cause(s) for each failure mode (5 Why’s)
- Estimate the severity for each failure mode & effect
- Estimate the likelihood of occurrence for each failure mode & cause
- Estimate your detection level for each failure mode, cause & effect
- Calculate the Risk Priority Number (RPN) & Risk for each failure mode
- Take Corrective Action to Reduce/Mitigate or Eliminate Risk
I’ve summarized this process into a nice little flow diagram:
Step 1 -Establish ground rules for your FMEA
This step is most easily accomplished with an SOP or Procedure that defines all of the requirements & ground rules associated with your FMEA.
If you don’t already have a procedure, you should, at a minimum, define the scales for Severity/Detection & Occurrence (discussed below) that you plan to use.
You’ll also want to document any assumptions used in the analysis – for example, if you plan on assuming that all raw material being used within the process is conforming, then you’ll want to state this up front.
Also, if you’re going to be performing an FMECA, or looking at a risk assessment from the FMEA, you’ll want to pre-define what your acceptable & unacceptable levels of risk look like.
Step 2 – Define Your System or Process
Before beginning the actual FMEA process it’s a good exercise to step by and ensure, across the entire team, that everyone agrees to the scope of the analysis.
This is very important for very complex analysis, like an automobile, where you’ll have multiple sub-systems that all have their own FMEA.
For a DFMEA, a system block diagram can be used to show the interfaces & relationships between the different aspects of your design, etc.
This will allow you to consider all of the functional requirements of that sub-system, and understand all of the interactions of that sub-system with other sub-systems, etc.
For a PFMEA, you can use a flow diagram to define your process and its various manufacturing steps that can contribute to a failure.
Step 3 – Identify Your Potential Failure Modes
 Alright – now you’re ready to start the FMEA process, which begins by identifying your potential failures modes.
I say potential, because you shouldn’t limit yourself to only failures that have occurred, but also consider how your process might foreseeably fail in the future.
For a DFMEA, a starting point for failure modes can begin with your functional requirements, where the failures can be the anti-function, or the lack of functionality of the product. You can then brainstorm causes & effects from there.
For a PFMEA your failure modes will be related to your various steps in the manufacturing process and how they might fail.
When discussing potential failure modes for each MFG step, consider the 8M’s of the Cause & Effect Analysis Tool along with Brainstorming & the 5-Why’s Tool to ensure you’re capturing all of the potential failure modes associated with each step in your manufacturing process.
I think it’s worth repeating these 8M’s here because they are all potential sources of a failure mode, with the exception of Materials, which is explained below:
- Man – how do the human interactions introduce potential failures; this is especially true for manual processes.
- Machine – how can your equipment or machines fail in a way that would result in a failure.
- Method – what written procedures do you have in place and how might they result in a failure.
- Materials* – this is the one exception to the analysis as generally most PFMEA’s & DFMEA’s assume that the raw material being used within the process is conforming to specifications.
- Mother Nature – how might your production environment contribute to a failure mode.
- Measurement – what measurement techniques & equipment are you using & how might that introduce failures.
- Management – what are the attitudes & priorities of management that might result in a failure.
- Maintenance – what type of maintenance & calibration activities are prescribed for your process and how might that contribute to a failure.
Remember to write these failure modes as the actual failure mode itself and not the effect on the customer; that will come later.
Step 4 – Determine the Effects for each Failure Mode
Now that you’ve determined all of the potential failure modes for your product or process, you’ll need to determine what the effect of that failure mode will be.
This effect is generally thought of as the effect on the end user or customer.
In this situation you’ll likely run into a situation where a failure mode can have various effects, depending on the level of severity of the failure.
In this instance it’s good to document those multiple effects so that you can properly analyze the severity & likelihood associated with each of those various effects.

Step 5 – Determine the Root Causes for each Failure Mode
The next step in the process is to begin to document the root causes for each of the identified failure modes within your process.
It’s important to note here that one failure mode can be caused by various root causes & contributing factors, each having a different effect on the end user.
All of these root causes should be thoroughly documented and can be analyzed later for any commonalities across your process.
These commonalities can clue you in to potential corrective actions to that are able to address these root causes that are common across your process.
Step 6 – Estimate the Severity of each Failure Mode
Ok so at this point in the process, you’ve identified failure modes, causes & effects, which in opinion is where the bulk of the work lies when it comes to an FMEA.
These first 5 steps also make up the “risk identification” step of the Risk Management Process.
Now it’s time to get into the Risk Analysis portion of the Risk Management Process, which includes the estimation of severity & occurrence (both of the elements of risk), along with detection.
Let’s specifically start with Severity, which is a measure of the degree to which the end user is impacted by the failure mode & effect.
Severity can also be thought of as a measure of the consequence of the failure mode & effect.
Severity can be assessed semi-quantitatively, using a ranking on a 1 – 10 scale, with 1 being the least severe, and 10 being the most severe.
The 10-scale is not universal however, and you can basically use whatever scale you want.
Severity can also be assesses in qualitative terms using terms like “inconsequential”, “very minor”, “minor”, “marginal”, “major”, “critical” or “catastrophic” to describe the severity of the failure mode & its effect on the customer.
Below is an example table showing both a semi-quantitative 1 – 6 scale (ranking) with its qualitative terms (Category) for Severity from Wikipedia:
[table id=30 /]
Step 7 – Estimate the Occurrence of each Failure Mode & Cause
The next step in the process is to assess the likelihood for occurrence for each failure mode its cause(s).
The Occurrence ranking is generally defined as the likelihood or probability that a failure will occur.
This likelihood for occurrence can be draw directly from your process capability studies or failure rate data captured during the development process.
Your Occurrence value should also take into account any other preventative measures that are in place to prevent the failure mode from occurring.
Occurrence should not consider any appraisal methods (testing) that are meant to detect failures after they have occurred, this should be captured in the detection rating.
Occurrence should be a pure reflection of how often the failure mode will occur; and should not include any testing or sorting for that failure mode.
For example, if you knew the DPMO (Defects Per Million Opportunities) or your Process Capability (Cpk, Ppk) these would be good starting points to estimate the likelihood or probability that a failure mode will occur.
In other situations where you’re assessing a potential failure mode, you may have to use your best judgment to estimate the likelihood for failure.
Similar to Severity, the Occurrence can be assessed in qualitative terms, semi-quantitative terms, or quantitative terms.
In qualitative terms, this can mean assessing the likelihood using words like “Never”, “Extremely Unlikely”, “Remote”, “Occasional”, “Sometimes”, “Often”, “Frequent”, etc.
From a semi-quantitative perspective, this can be a simple 1 – 6 scale, with one being the least frequently occurring failure mode and 6 being the most frequently occurring failure mode.
From a quantitative perspective, you can link your 1-6 scale directly to your known Process Capability or measured DPMO for your process or failure mode.
[table id=31 /]
Step 8 – Estimate the Detection level for each Failure Mode
Alright, on to the last estimation, the Detection Level.
Your “Detection” is a reflection of the capability of your process to identify the failure mode once it has occurred. This can also be thought of as a reflection of the effectiveness of your process control strategy to identify failures.
[table id=32 /]
Similar to Severity & Occurrence discussed above, your processes Detection capability exists on a scale with 1 being a very strong detection method and 6 being absolutely no detection.
This is the 3rd and final rating for each failure mode, which means we’re now able to calculate Risk & RPN (Risk Priority Number).
Before we get into that thought, let’s quickly review the difference between Occurrence & Detection, because that can get a little tricky.
Reviewing The Difference Between Detection & Occurrence
When you’re assessing the Detection & Occurrence of a failure mode it’s important to have a good understanding of the difference between the two.
You’ll also need this understanding when you’ve taken corrective action as a result of your FMEA, which will force you to decide if you your corrective actions should result in the reduction of the likelihood value or an increase in detection.
So for example, let’s say that you’ve got an existing failure mode with the following 3 scores:
- Severity = 6
- Occurrence = 4
- Detection = 3
Now you’ve implemented a corrective action and you need to either reduce the occurrence or improve the detection (which would mean a reduction in the detection score) – how do you know which one to pick.
The answer is it depends on your corrective action.
If the corrective action is increased appraisal (inspection, testing, measurement, etc) that the right answer is to decrease detection.
If the corrective action was the redesign the production tooling to error-proof the process (prevention), then the right answer is to decrease occurrence.
If you were to improve your process capability for a particular manufacturing step by either reducing variation or centering your process, this corrective action would fall in to the occurrence bucket, not detection.
The key to remember here is that preventative measures that prevent the failure mode from ever recurring impact occurrence, and any sort of inspection/testing would be considered an appraisal effort to detect the failure mode after it had occurred.
Step 9 – Calculate RPN & Risk to Identify Opportunities for Improvement
 At this point you’ve laid out your whole process and identified all of the potential failure modes associated with each step on the process, along with their root causes & potential effects on the end user.
You’ve also analyzed each of those failure modes to determine their frequency of occurrence, the capability of your process to detect that failure once it has occurred, and the severity of that failure on the end user.
Now you must perform the final calculation, but before we get to that, let’s spend a second discussing why we perform this final calculation.
You’ve got limited resources, and you’ve got a nearly completed FMEA with perhaps hundreds of failure modes. You can’t imagine trying to tackle all of these failure modes.
How do you know where to start? This is why we have RPN & Risk.
These two concepts give us an objective prioritization tool to determine the “high risk” failure modes that we should focus on first.
Using these concepts will ensure your time, energy, effort & money is spent effectively in mitigating risks associated with your product or process.
Another perspective here, which we will discuss below, is to go beyond the simple prioritization of failure modes using RPN & Risk and move towards the prioritization of the corrective actions with the Risk Mitigation Matrix which is also discussed below.
Risk Priority Number (RPN)
The ability to prioritize improvements based on risk or RPN is one of the major benefits of the FMEA because it allows you to analyze all failure modes on a common scale, etc.
RPN or Risk Priority Number is a dimensionless number that is calculated by combining the Severity, Occurrence & Detection rating for each of your identified failure modes & effects.

If you were using a 10-scale rating system for Severity, Occurrence & Detection then your maximum RPN would be 1,000, and your minimum RPN would be 1.
Once you’ve calculated the PRN value for each failure mode within your FMEA, you’ll then be able to quickly determine which failure modes have the highest RPN and thus potentially warrant a corrective action to mitigate risk.
Risk
As opposed to PRN, Risk is only a combination of Severity & Occurrence. Risk does not take into consideration the Detection capability associated with your process.

Take for example the below table which is a 6×6 risk table with severity on the Y-axis and occurrence on the X-axis.
This perspective is taken more often in DFMEA’s as opposed to PFMEA’s because in a DFMEA there’s really no such thing as “Detection” and oftentimes the detection of a failure mode is merged into the Occurrence factor.
Below is an example 6×6 risk matrix that could be used to analyze your failure modes.
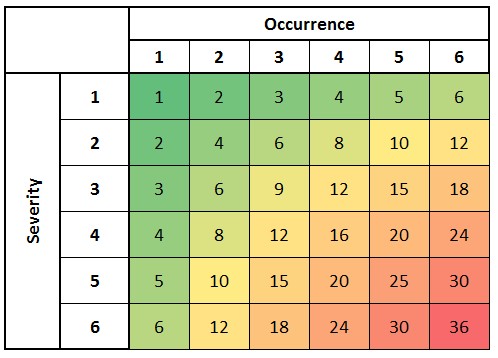
This risk table can be further grouped into 3 regions:
- Low Risk is any failure mode with a score from 1 to 12.
- Medium Risk is any failure mode with a score from 13 to 24.
- High Risk is any failure mode with a score from 25 to 36.
The Risk Mitigation Matrix & the Cost-Benefit Analysis
The last tool that I wanted to discuss is the Risk Mitigation Matrix which is another method to help you identify & prioritize which risk mitigations will have the biggest impact on your process.
Hint – it’s not as simple as looking at the RPN or Risk you calculated.
This Risk Mitigation Matrix can then be used alongside the Cost-Benefit Analysis tool to truly determine which corrective actions will provide you with the most cost-effective improvement to your product/process in terms of quality/safety & reliability.
Ok, so the classic FMEA process assumes that all risks are independent, however the Risk Mitigation Model challenges that assumption.
The Risk Mitigation Matrix is based on the idea that it is possible to find mitigation activities that can impact multiple areas of risk at once, and thus would provide more benefit than simply addressing only one failure mode at a time.
By identifying risk mitigations that can successfully reduce the risk of multiple failure modes, you’re able to reduce risk further than if you were to single-mindedly focus on the failure modes that simply have the highest RPN or Risk score.
You can then take this list of mitigations, which have now been assessed for their full impact, in terms of risk mitigation, and put a cost associated with that corrective action.
By combining the mitigation (benefit) with the cost, you’re now able to create a cost/benefit matrix to identify the mitigations that result in the biggest benefit for the lowest cost. This is the idea of a cost-benefit analysis.
With this data in hand, it is possible for you to create a list of recommended corrective/preventative actions to reduce or mitigate risk associated with your product or process.
Step 10 – Corrective Action to Mitigate Risk
 The last, and probably the most important step in the whole process is the corrective actions that you take to mitigate risk.
You’ve now analyzed & assessed the risk associated with each failure mode and determined which risks are the highest and should be mitigated.
In fact, you’ve now characterized the entire risk profile of your process – great job!
But you’re not done.
You now have to implement corrective actions to reduce risk, where appropriate.
I want to stress that the entire process is worth very little unless you’re able to take actionable measures to improve your process/process & reduce risk.
Don’t get me wrong, it’s nice to have a good understanding of your risk profile.
However the real benefit of performing an FMEA is to identify which failure modes, if they were addressed, would have the biggest impact on your products quality, safety, reliability, etc.
So get to work!
The FMECA (Failure Mode, Effects Criticality Analysis)
The FMECA, or Failure Mode, Effects & Criticality Analysis is almost identical to the FMEA with one additional activity – a Criticality Analysis.
Criticality in this sense is very similar to the concept of Risk in that it is the combination of Severity & Occurrence.
Similar to the discuss above regarding risk, this criticality assessment provides another method or tool to assess & compare the relative risk of each failure mode associated with the design (product) or process.
The Criticality Analysis takes the Severity & Occurrence ratings given to each failure mode in the FMEA and charts them on a risk matrix for further review & analysis.
This is very similar to the discussion earlier on Risk which also combines Severity & Occurrence of failure modes.
Below is an example of a 10×10 matrix that has failure modes A – T shown on the matrix. With this information at hand you can quickly determine which failure modes require corrective action.
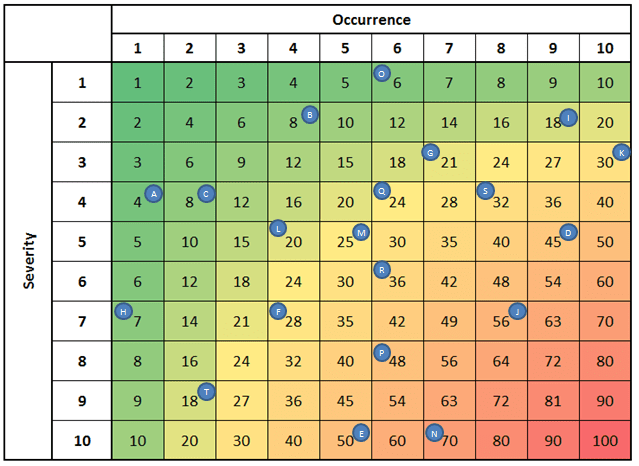
As you can see above failure modes N, J E, P & D have the highest risk scores as compared to the remaining failure modes, and can be potential targets for corrective action.
Fault Tree Analysis (FTA)
The Fault Tree Analysis is the 3rd and final tool that can be used to assess the reliability & safety of your products or processes.
The FTA is a bit different than the FMEA.
The FMEA started with the lower level failure modes and then works its way up to the effects on the customer, which is considered a “bottom up” approach.
Whereas the Fault Tree Analysis starts with the “top level” event and then subsequently determines all of the lower level fault conditions or failure modes that can result in, or contribute to the occurrence of that top level event.
This is the “top down” approach and it’s beneficial if you have a limited number of top level events that you want to analyze.
Think of these top level events an extremely undesirable event – perhaps harm to your customer or some other loss of a mission critical feature.
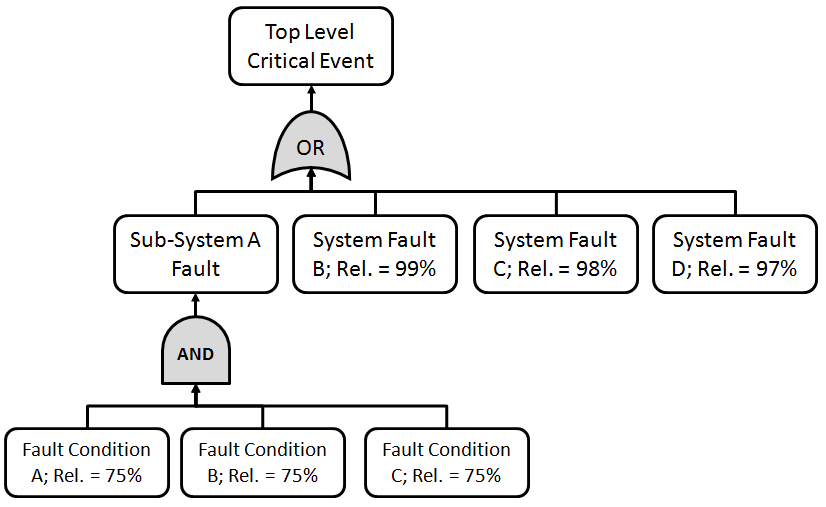
The Fault Tree Analysis then results in an actual tree diagram showing the relationship between the top level event and the lower level fault conditions.
Fault Tree Analysis & Reliability Analysis
Where the fault tree becomes powerful is its ability to define the relationship between the top level event & the fault conditions that can cause or contribute to that event.
The fault tree analysis is able to define that relationship using logic gates, which allow you to estimate the overall reliability or likelihood of occurrence for the top level event.
This likelihood of occurrence can be paired with the severity of the top level event to calculate the risk associated with that event.
Let’s start by discussing the first half of that relationship – likelihood of occurrence (reliability).
To estimate the overall reliability for the top level event being analyzed, you must understand the relationship between the lower level fault conditions.
Do multiple faults have to occur before the high level event occurs? Or does only one of the lower level fault conditions have to occur before the high level event (harm) happens.
To document and describe this relationship, the FTA analysis uses logic gates discussed below.
The FTA Logic Gates
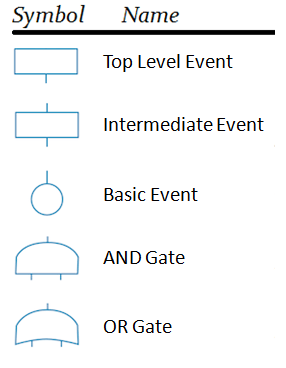
There are two types of Logic Gates that are in scope of this discussion, the OR Gate and the AND gate, which are shown below next to the other FTA symbols:
The OR Gate
The OR Gate captures the type of relationship where any of the lower level causes or events can result in the top level event.
Using the FTA above, this symbol can be interpreted like this: An email server is down for more than 4 hours if there is a hardware failure OR a loss of power.
The Loss of power only occurs if there is a power supply failure AND there is no spare. The power supply failure is caused by a clogged filter.
When calculating reliability for a system that’s using an OR gate the overall likelihood of the top level event occurring can be calculated by simply the multiplying the reliability of or likelihoods of all of the lower level events together.

The AND Gate
In contrast to the OR Gate, the AND gate captures a situation where ALL of lower level faults must occur before the top level event happens.
Below you can see that the top level critical event only occurs IF all of the conditions below it occur:
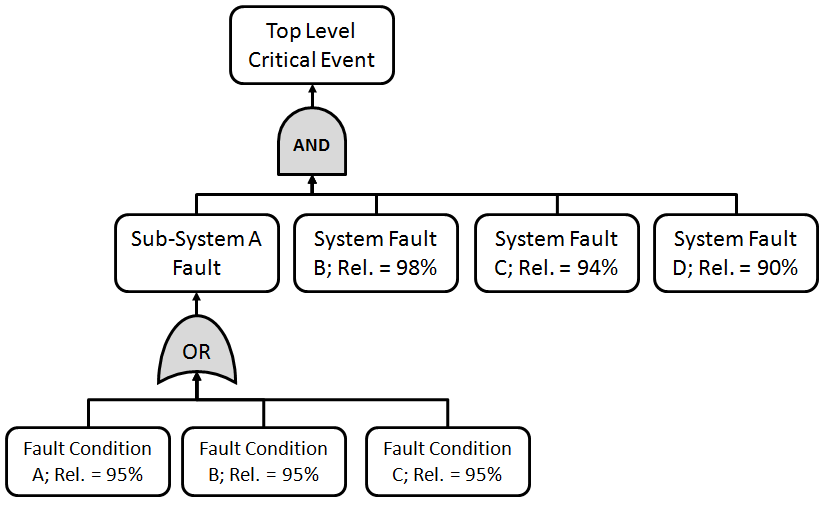
When calculating reliability for a system that’s using an AND gate the overall likelihood of the top level event occurring can be calculated using the equation below:

FTA Reliability Calculation Example
The two following Fault Tree’s below are identical in terms of the top level event (Coffee Doesn’t Brew), and the lower level events that are related to that top level event. The reliability of these lower level events, i.e. their likelihood of occurrence are also the same.
The only difference is the relationship between the top level event and the lower level fault conditions – being the AND/OR gate.
Let’s see what happens to the overall reliability (likelihood for success), when we switch from an OR relationship, to an AND relationship; where each lower level fault has a likelihood of success (reliability) of 95% or .95.
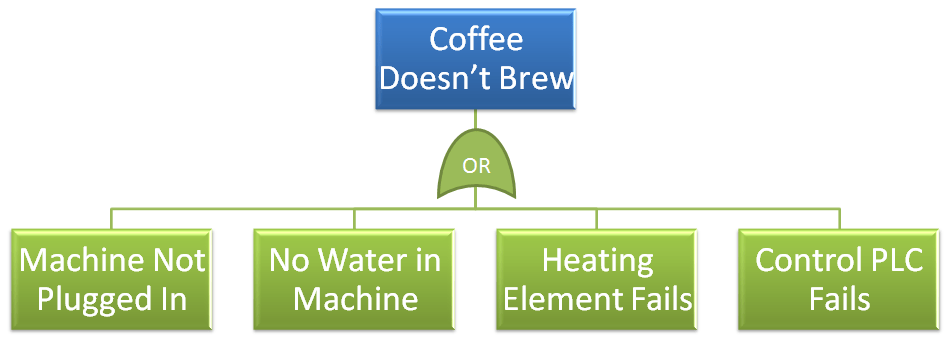
With the OR gates, where any lower level fault can result in the top level event, where each lower level has fault has .95 reliability (likelihood of success), the overall reliability (likelihood of success) for the top level event is only .81 or 81%.
This means that the likelihood for failure is 19% – and you’re out a cup of coffee!

On the flip side, if you have a situation where the system only fails when ALL sub-systems fail, as in the AND Gate situation.
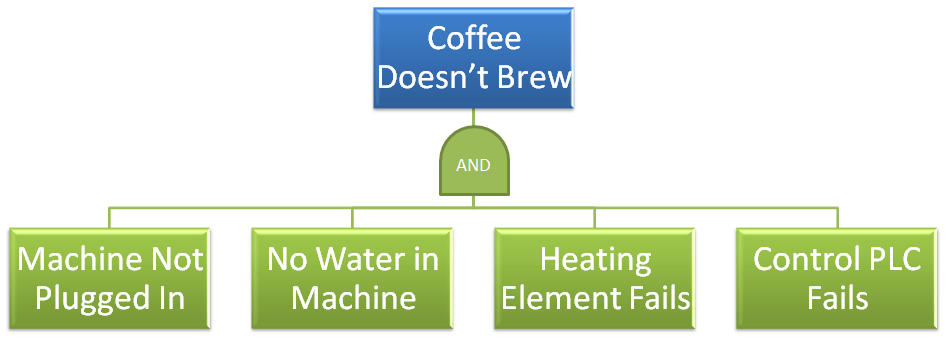
So if we were to re-run the situation above, where you had 4 sub-systems that each had an individual reliability of 90% (10% unreliability or Un), what would the overall system reliability be?

Conclusion
Alright, well that concludes the final chapter with the Product & Process Design section of the CQE Body of Knowledge.
This section was dedicated to three different Risk Management Tools, which include:
- the FMEA or failure mode and effects analysis,
- the FMECA or failure mode, effects, and criticality analysis and
- the FTA or fault tree analysis.
These tools can be used during the product & process design phase to move through the risk management process including risk identification, risk analysis & risk evaluation. They also contribute to risk control, risk reduction & ultimately risk acceptance.
The benefits of these tools were discussed and are synonymous with the benefits of risk management and include benefits for product & process design, product & process control, continuous improvement, quality, reliability, safety, etc.
At this point we jumped into a detailed discussion regarding the FMEA process, including a quick discussion regarding the similarities, differences & connections between a PFMEA & DFMEA.
Then we moved into a review of the 10 step FMEA process below:

The FMECA was next, where we discussed the criticality analysis matrix, including how to construct and interpret that matrix.
Lastly was the Fault Tree Analysis, which included a description of how to construct a fault tree analysis using the different symbols & logic gates.
The OR & AND gate being the two most important gates & how that impacts the system reliability calculations that can be performed using the FTA.