
The sixth pillar of the CQE Body of Knowledge is the Quantitative Methods & Tools and it contains 8 main chapters within it:
- Collecting & Summarizing Data
- Probability (Quantitative Methods)
- Probability Distribution
- Statistical Decision Making
- Relationships Between Variables
- Statistical Process Control
- Process & Performance Capability
- Design and Analysis of Experiments
Statistics is the most difficult portion of the CQE exam, and represents 23% of the exam (36 out of 160 exam questions).
Collecting & Summarizing Data
I broke this section up into two separate parts. Part 1 is the following four basic concepts.
Types of data – Define, classify, and compare discrete (attributes) and continuous (variables) data.
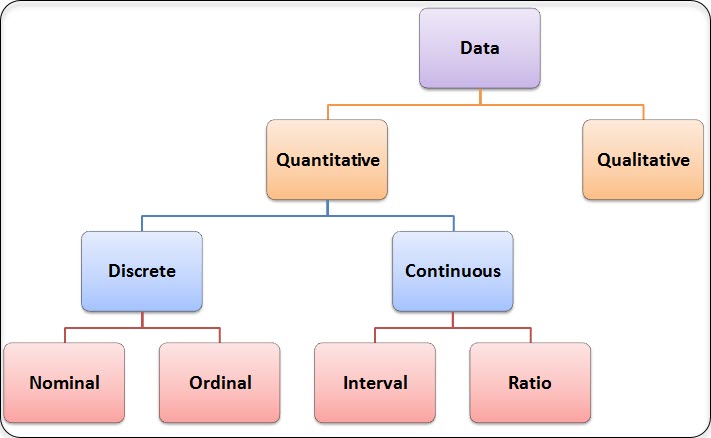
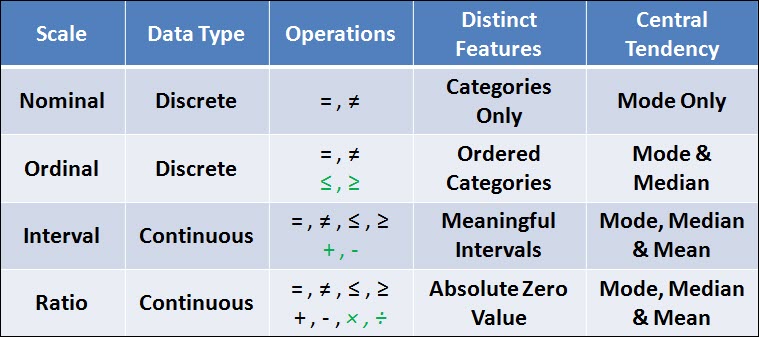
Measurement scales – Define, describe, and use nominal, ordinal, interval, and ratio scales.
Data collection methods – Describe various methods for collecting data, including tally or check sheets, data coding, automatic gaging, etc., and identify their strengths and weaknesses of the methods.
Data accuracy – Apply techniques that ensure data accuracy and integrity, and identify factors that can influence data accuracy such as source/resource issues, flexibility, versatility, inconsistency, inappropriate interpretation of data values, and redundancy.
Part 2 of Collecting & Summarizing Data is dedicated to the following 4 topics which is more associated with the summarization of data.
Descriptive statistics – Describe, calculate, and interpret measures of central tendency and dispersion (central limit theorem), and construct and interpret frequency distributions.
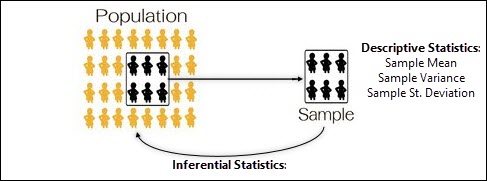
Intro to Inferential Statistics – Distinguish between descriptive and inferential statistics. Assess the validity of statistical conclusions by analyzing the assumptions used and the robustness of the technique used.
Graphical methods for depicting relationships – Construct, apply, and interpret diagrams and charts such as stem-and-leaf plots, box-and-whisker plots, etc.

Graphical methods for depicting distributions – Construct, apply, and interpret diagrams such as normal and non-normal probability plots.
Within these four areas we will discuss the difference between populations & samples; along with the relationship of descriptive statistics to inferential statistics.
Probability
This chapter is dedicated to Probability, and specifically the following areas:
Terminology – Define and apply quantitative terms, including population, parameter, sample, statistic, random sampling, and expected value. (Analyze)

Probability terms and concepts – Describe concepts such as independence, mutually exclusive, multiplication rules, complementary probability, and joint occurrence of events. (Understand)
Probability Distribution
This section is broken down into 3 sections.
Part 1 is an Introduction to Probability Distributions.
We start by answering the question – What is a Probability Distribution. Then we discuss how your data types impact your probability distributions.
Part 2 is dedicated to Continuous Probability Distributions.
This includes the Normal Distribution, The Uniform Distribution, The Bivariate Normal Distribution, The Lognormal Distribution, The Exponential Distribution, The Weibull Distribution, The Chi-Squared Distribution, The Student T Test Distribution & the F Test Distribution.

Within this section we will discuss the common applications for each distribution as well as how to calculate the expected value (Mean) and variance for each distribution – where applicable.
Part 3 is dedicated to Discrete Distributions.
This includes The Binomial Distribution, The Poisson Distribution, The Hypergeometric Distribution & The Multinomial Distribution.
Similar to part 2, we will review these distributions common applications, shape, expected value calculations, and do example of common probability calculations.
Statistical Decision Making
Statistical Decision Making is broken up into 5 unique chapter:
- Point Estimates & Confidence Intervals
- Hypothesis Testing
- Goodness of Fit Testing
- ANOVA Analysis
- Contingency Tables
Point Estimates & Confidence Intervals is Part 1 of Statistical Decision Making
The best place to start in Inferential statistics is with the basic concept of Estimators which include Point Estimates & Interval Estimates.
This chapter is laid out in two sections, the first is dedicated to the Point Estimate, and the second is for the Interval Estimate.
Within the Point Estimate section of this chapter we will:
- Review the concept of Populations & Samples
- Discuss the Point Estimate for the Population Mean, Population Variance & Standard Deviation,
- Discuss the concept of an Unbiased & Efficient Estimates &
- A review of the concept of Standard Error
Within the Interval Estimate Section we will:
- What is a Confidence Interval?
- Confidence Intervals for the Population Mean
- Confidence Intervals for Population Variance & Standard Deviation
- Confidence Intervals for Proportions
Hypothesis Testing is part 2 of Statistical Decision-Making
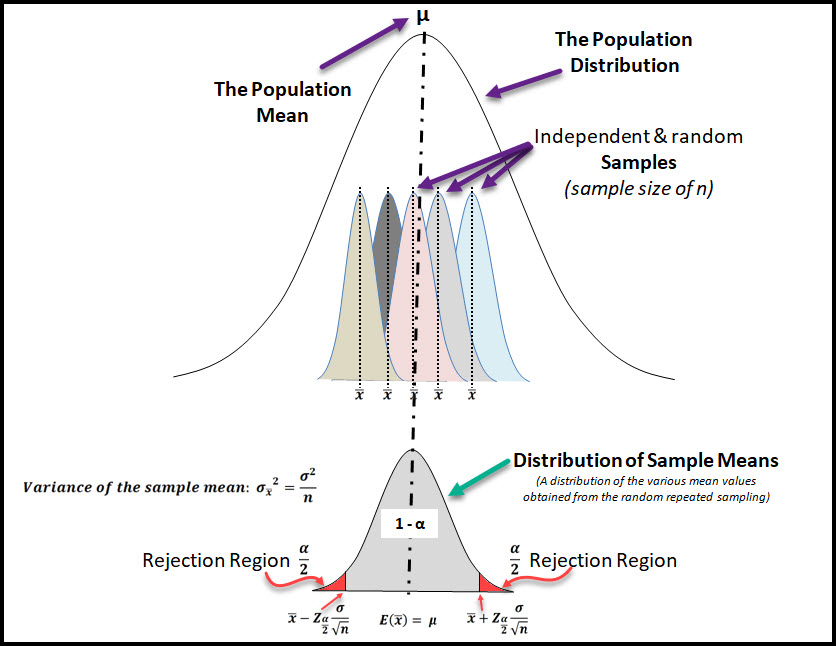
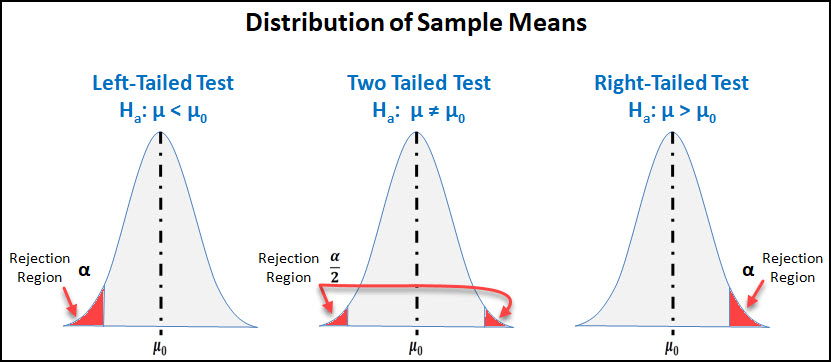
This chapter starts with a refresher of inferential statistics, specifically about sampling distributions which are an important concept in hypothesis testing.
We then move on to the 6-step process for performing a hypothesis test which is the meat & potatoes of the chapter.
From here we go into the specific population parameters & situations where a hypothesis test can be conducted:
- The Population Mean using the Normal Distribution & T Distribution
- The Population Variance & Standard Deviation using the Chi-Squared Distribution & F-Distribution
- The Population Proportion using the Normal Distribution
We wrap up the chapter with a few additional concepts like:
- Type I and Type II Errors in Hypothesis Testing
- The Power of a Hypothesis Test
- Statistical Significance versus Practical Significance
- Using The P-Value Method
Part 3 of the Statistical Decision-Making Chapter is Goodness Of Fit Testing.
Goodness of Fit Testing is a method we can use to confirm if our sample data came from a population that fits a specific distribution.
Normality is also a requirement for certain statistical tools to be accurate & true.
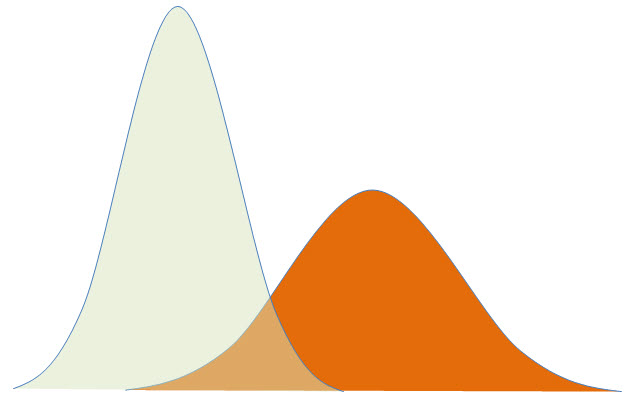
Goodness of Fit Testing can be conducted to verify that our sample data came from a population of a certain distribution.
This chapter starts with a quick explanation of what is goodness of fit test is. Then we move on to how to do a goodness of fit test with 2 quick examples.
Part 4 is dedicated to the important topic of ANOVA Analysis.
ANOVA stands for ANalysis Of VAriance and it is a hypothesis test used to compare the means of 2 or more groups.
This chapter starts with the assumptions associated with ANOVA, and includes the common terms & definitions within ANOVA (and DOE).
Then I explain why ANOVA analysis uses Variance to Test Mean Values.
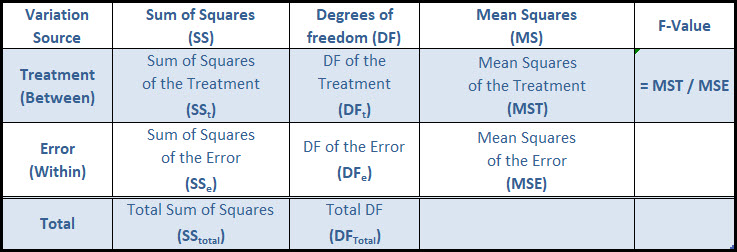
Fourth, we go through the basics of ANOVA including the Sum of Squares, Degrees of Freedom, Mean Squares, F-value.
Then we review an example of a One Way ANOVA and use all of the basics we just learned.
Last, we introduce the idea of a Two Way ANOVA, including new terms and concepts.
Part 5 of Statistical Decision-Making is the Contingency Table tool.
A contingency table is a special type of hypothesis test used with attribute data. The contingency table is used to determine if the two factors being studied are statistically independent of each other, or if they share some level of dependence.
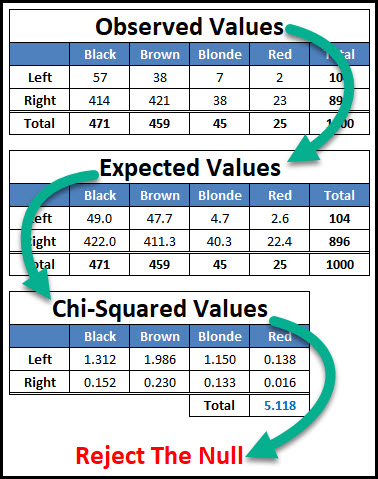
Our focus is going to be on the Two Way Contingency Table which involves 2 factors studied at multiple levels.
This chapter will cover the 4 step process for creating and analyzing a contingency table.
Relationships Between Variables
This chapter starts with an introduction to Linear Regression and the Least Squares Method to show you how to model the linear relationship between two variables.
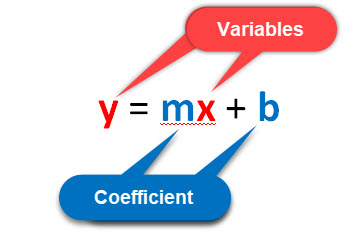
This section also shows you how to use a hypothesis test to confirm that a linear relationship exists between two variables.
Second, we jump into Simple Linear Correlation which answers the questions – how strong is the relationship between these two variables being studied (Pearson’s Correlation Coefficient).
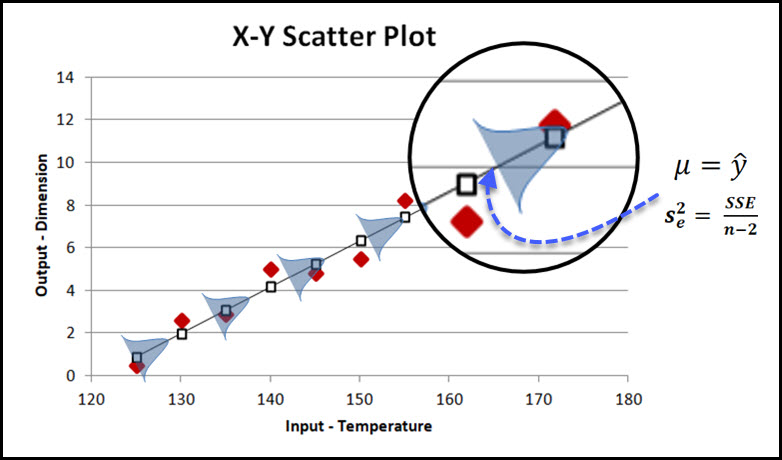
This section also includes the coefficient of determination to answer the question – what percentage of the variation in Y can be explained by the variation in X.

Third and Finally, we wrap up this section with a quick introduction to time-series analysis, which will launch us into the next chapter on statistical process control.
Statistical Process Control
Statistical Process Control (SPC) is a collection of tools that allow a Quality Engineer to ensure that their process is in control, using statistics 😊.
The most common SPC tool is the control chart which is the focus of this chapter.
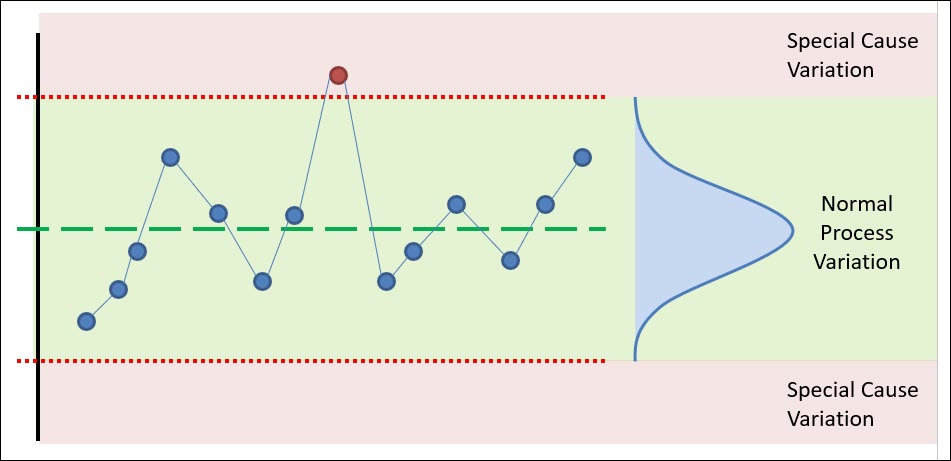
This chapter starts the objectives and benefits of SPC & Control Charts.
Then we explain the “WHY” behind SPC, which is variation, and the two types of variation that all processes experience.
We then review the process of creating a control chart, which starts with selecting the right variable to monitor, and the concept of rationale subgroups.
Next, we discuss the 3 common variable control charts and 4 attribute charts.
For variable charts, I’ll explain the I-MR, the X-bar & R, and the X-bar and S chart.
For attribute charts, I’ll explain the p-chart, np-chart, c-chart and u-chart.
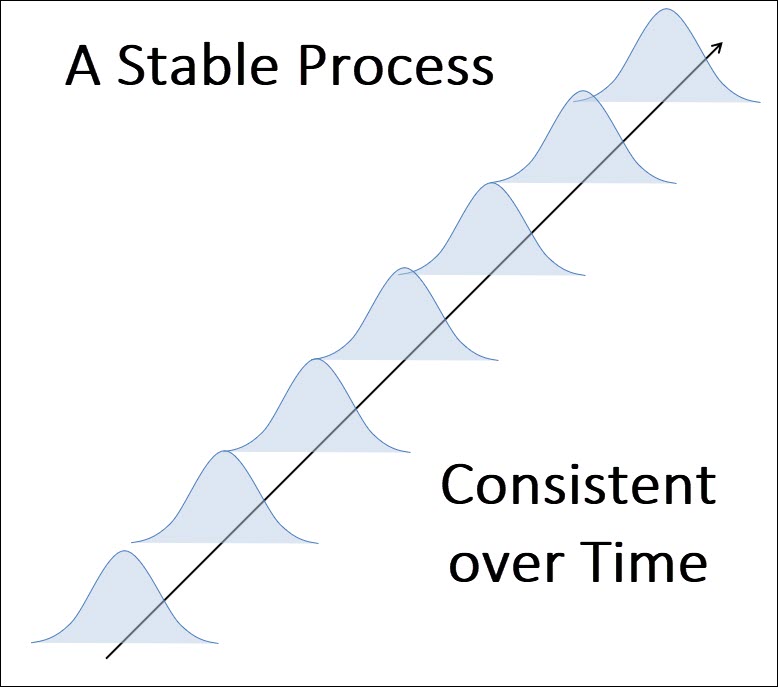
Once we’ve identified and constructed our control chart, it’s time to analyze our control chart. We will review the various rules you should be using to determine if you’re in statistical control.
This is the bulk of SPC, but before we close out we will wrap up with two other topics, Pre-control charts, and short run SPC. We’ll give a brief intro into these tools and how the work.
Process & Performance Capability
This chapter is dedicated to this topic and has 6 major sections:
Section 1 – What is Process Capability Analysis & Why It Matters
Section 2 – Understanding the Prerequisites of a process capability study
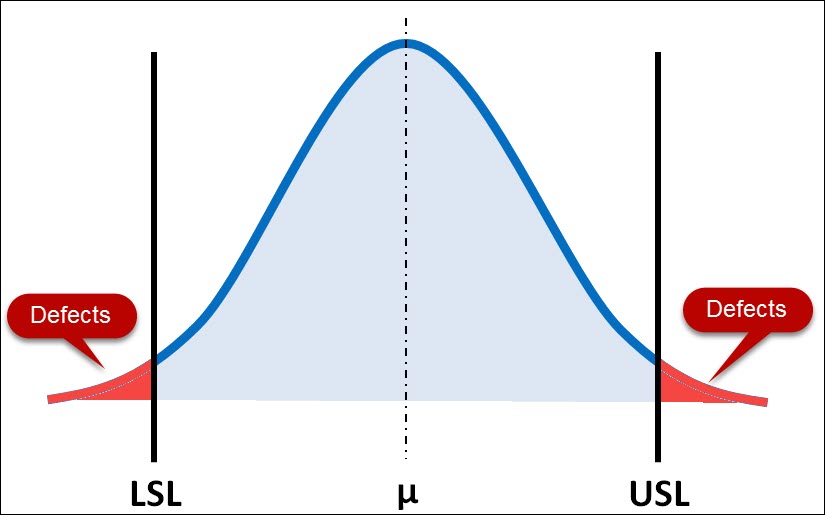
Section 3 – How to calculate the 4 major process capability indices including Cp, Cpk, Cpm & Cr .
Section 4 – Understanding the 2 major process performance indices including Pp, Ppk.
Section 5 – How to interpret the results & the 5 Reactions to your process capability study.
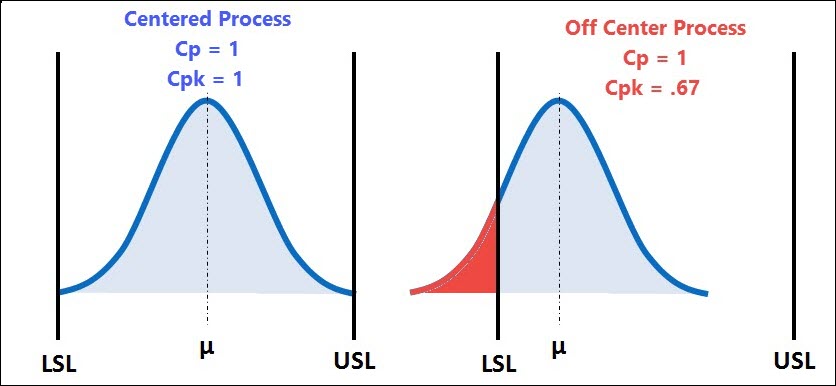
Section 6 – 4 pro tips to optimize your process capability analysis and have confidence in the results.
Design and Analysis of Experiments
A design of experiments or DOE is a statistical method that allows you to study and quantify the relationship between the inputs (factors) and outputs (responses) of a process or product.
The DOE tool is powerful in its ability to study multiple factors (inputs) simultaneously to determine their effect on the response (outputs).

This chapter is laid out into 6 sections leading you through the must know DOE topics, concepts and techniques.
Section 1 is the basic terminology used within the world of DOE which include Factors (Inputs), Response (Outputs), Levels, Treatments, Error, Replication and Robustness.
Section 2 is the basic process of how to plan, organize, execute and analyze a well-designed experiment.
The goal of this section is to help you identify the proper design to use for your experiment and the goal you’re trying to accomplish.
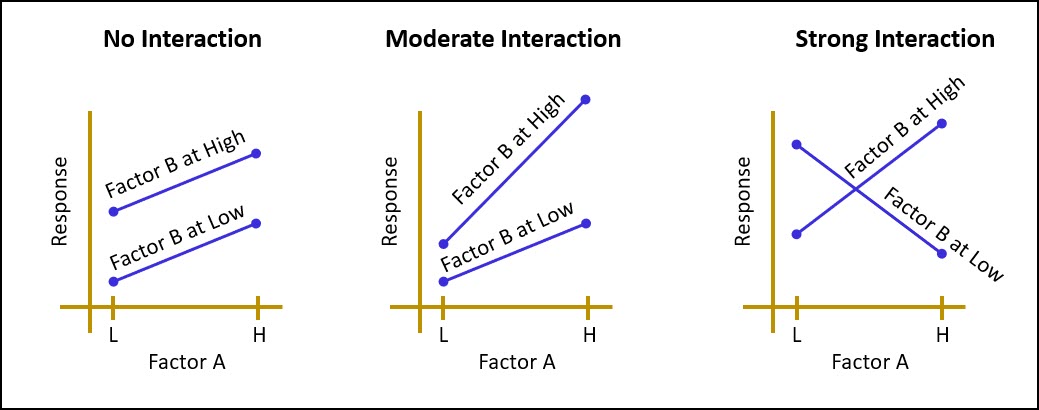
Section 3 are the critical design principles that must be applied to a designed experiment which include blocking, replication, sample size, power, efficiency, interactions and confounding.
Section 4 is an introduction to the simplest of DOE’s which is the One Factor Experiment. Within this section we will also refresh ourselves with ANOVA, which is the most common analysis technique that is paired up with a DOE.
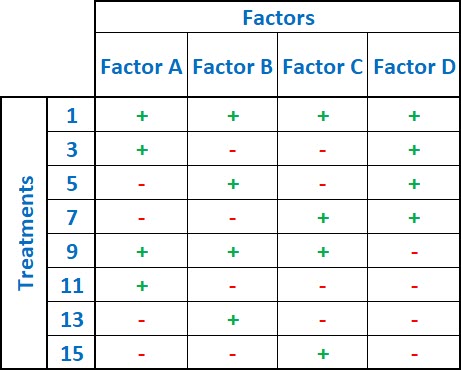
Section 5 is the more complex Full Factorial DOE with an example.
Section 6 is the Fractional Factorial DOE.
Ready to see the next Major Pillars: Risk Management, The Quality System, Management & Leadership, Product & Process Design, Product & Process Control & Continuous Improvement.
Have a comment question or concern? Please don’t hesitate to Contact Me.