 What is a Cause & Effect Diagram
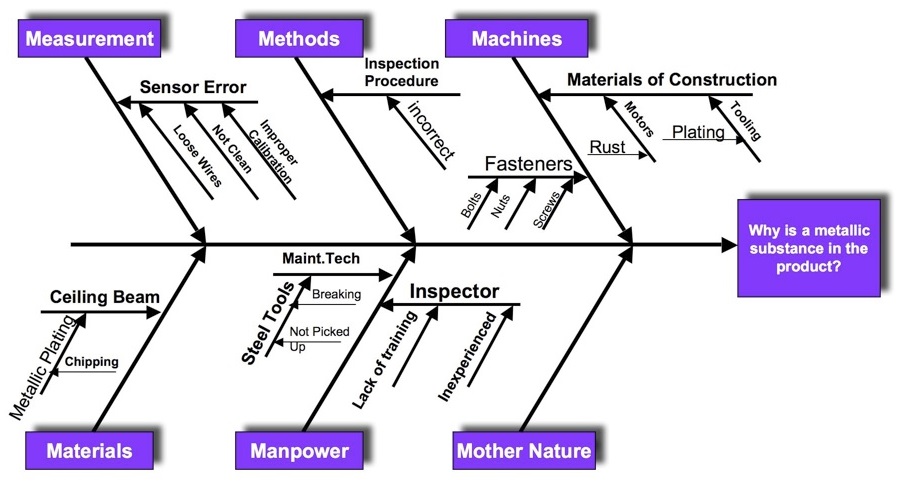
The Cause and Effect diagram is a visual method or tool that is meant to be used to explore all the potential factors that may be causing or contributing to a particular problem (effect).
This tool was created by a pioneer in the field of Quality Management ,Kaoru Ishikawa, and allows you to visualize all the potential contributors to a problem, then select those which require further investigation.
One of the major reasons for the success of the Cause & Effect Diagram as a Quality Tool is that it is so simple to use and can easily be combined with other Quality Tools, more on this below!
Another underrated characteristic of the Cause & Effect Diagram is its effectiveness as a communication aid. Especially when you’re dealing with a very complex issue.
You may also hear the Cause & Effect Diagram being commonly referred to as the Fishbone Diagram, the Ishikawa Diagram, Cause & Effect Matrix, C&E Diagram or the C-E Diagram.
When to Use the C-E Diagram
The Cause & Effect diagram should always be utilized during the Problem Identification phase of an investigation to determine all potential root causes.
In fact, the C-E Diagram is probably one of the best places to start when it comes to root cause determination. The only other tool that I’d recommend using before this one is the flow chart.
By having a flow chart ready during your Cause & Effect analysis, it will allow you and your team to keep the full process/product in mind.
Nancy Tague in her book The Quality Toolbox also strongly recommends that you use this tool anytime you’re in a rut and I completely agree. There’s no better tool to use when you’re out of ideas than the Cause & Effect Diagram.
Tips for Using the Cause & Effect Diagram
I mentioned above that the C-E Diagram should almost always be used in conjuncture with other Quality Tools such as the 5-why’s technique and a Brainstorming Session. Using these tools along with the C-E Diagram will focus your team on the problem, dig deep into each potential cause & result in a very effective discussion!
I’ve sorta hinted at this already, because nobody has a brainstorming session by yourself, but something that deserves repeating is that when you’re using the C&E tool, you should never perform the analysis by yourself, which is why the C-E Diagram is a lot like Monopoly where you should never play alone!
Including all the subject matter experts for your process or product will ensure that key details are discussed as these likely causing or contributing to your issue at hand.
Another tip for creating an effective C&E Diagram is to have your team first agree on a good problem statement. If you’ve already created a Pareto Chart of your problem, then your problem statement can be taken straight from that, for example:
“Why are late deliveries causing 45% of our customer service issues”
Lastly, after creating your C-E chart – look for repeating causes or special interrelationships between the different categories. This is usually a big clue as to the root cause of your problem.
Common Cause & Effect Diagrams
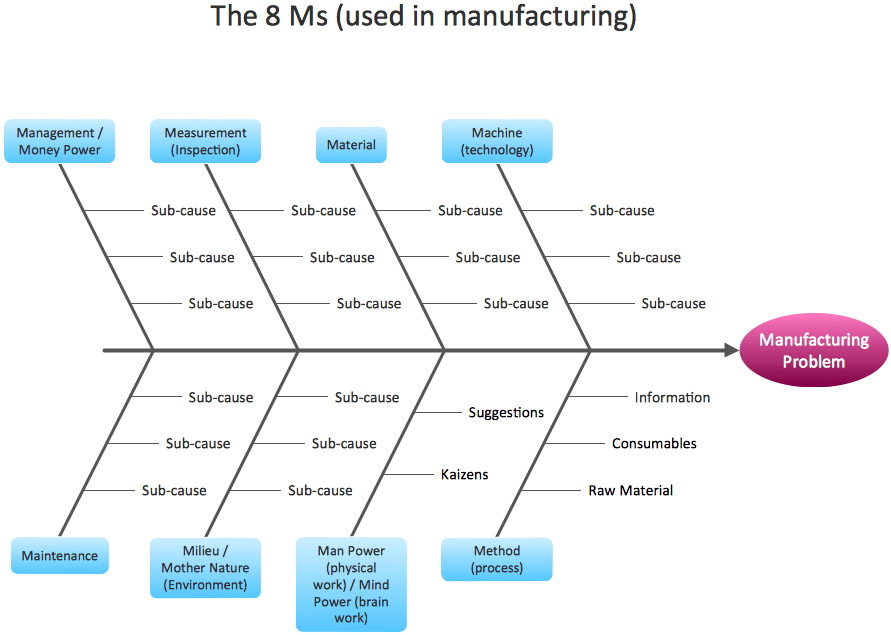
Below are 2 of the common C-E Diagrams. The first is called 8M and these are the 8 common root causes that would result in a product or process related issue.
There are many variations of the 8Ms, and you should feel free to use all, or only a few of these root cause categories during your analysis.
8M – The 8 Common Causes for Product/Process Related Issues
- Man – How do Humans interact with your process and how could that impact your product functionality.
- Machine – What type of equipment or machinery are used in your process how could a deviation here impact your products functionality.
- Method – What type of procedure do you follow in your process and are potential deficiencies resulting in product deficiencies?
- Materials – What type of material is currently being used and how could any deviations here result in your products non-conformance.
- Mother Nature – How does mother nature interact with your part and could that be resulting in your observed non-conformance.
- Measurements – What type of measurements, measurement equipment and QC points do you currently use and is this resulting in the observed non-conformance.
- Management – What are the attitudes, outlook & priorities of management and how could this be resulting in your observed non-conformance.
- Maintenance – What type of maintenance/calibration activities are being performed on your machines or measurement equipment that could be resulting in your observed non-conformance.
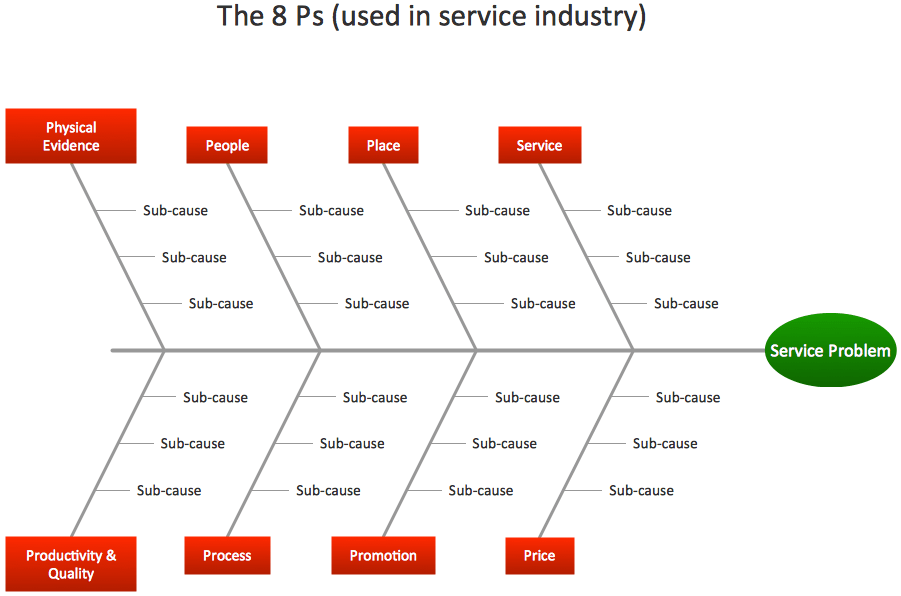
8P – The 8 Common Causes for Service Related Issues
The 2nd most common C-E Diagram is called the 8P which is similar, however these are the 8 common root causes associated with your potential service related issue.
- Price – How does price affect or influence a service related issue.
- Promotion – How have your promotions or marketing plans contributed to a service issue.
- Process – How could your current service process cause or contribute to a service issue.
- Place – How could the location of your customer or service cause or contribute to a service issue.
- People – How have your people (sales force, customer service team) caused or contributed to a service issue.
- Physical – How have physical things, like mother nature, cause or contributed to your service issue.
- Productivity & Quality – How have things like Productivity (Supply Chain, part availability) resulted in a service issue.
- Service – How has Service nuances resulted in a service issue.
A Short Video
The video is brought to you by Jeff Hajek at www.velaction.com who’s 5 star book Whaddaya Mean I Gotta Be Lean? can be found here on Amazon.
C-E Templates and Stuff
The American Society for ASQ has a fairly useful free template for creating a Cause & Effect Diagram.
I’ve also used a free Mind-Mapping software called XMind that has a template specifically for Fishbone Diagrams that’s much easier to use than the ASQ Excel spreadsheet.
Practice Quiz
Below are 5 questions that hopefully will challenge your knowledge of the Cause & Effect Diagram!